Suitability and Community Risk Modeling Using Raster Analysis
Suitability Model
This model used five variables to determine the suitability of a frac sand mine in Trempealeau County.The five are:
- Geology
- Slope
- Rail Terminal Proximity
- Water Table
- Land Cover
Each of the variables were converted to a raster if they were not already, and then a suitability ranking was developed to determine how each variable would function as a frac sand mine (Table 1). These rankings were determined off of a variety of factors. The geology layer was ranked based off of availability of sand. If there is no sand, the model determines that there is no functionality for a sand mine. The land cover layer is classified based on ease of access to the potential sand layers below. The railroad proximity layer is ranked based on how far mined sand should travel before setting off on a rail car. For the slope layer, smaller inclines are prioritized so that excavation can proceed with relative ease. Finally, the water table layer is ranked based on how deep the water table is, as deeper water tables are desired in mining.
The rankings are as follows:
1= Low Suitability
2 = Medium Suitability
3 = High Suitability
 |
| Table 1: Suitability layer rankings and their justifications. |
Before reclassifying all of the layers to their rank orders, a few additional processes had to occur. The geology layer is a vector file and must be converted to a raster file before use. The rail terminals had a euclidean distance process run to determine cell value distances. Finally, the DEM had to have the slopes determined of the entire study area. Once these methods were completed, the 5 variables were reclassified based upon the criteria above (Table 1). After this, model builder was utilized to build a model that would combine all of the variables into one index raster for mine suitability (Figure 2).
 |
| Figure 2: Model built to create an index raster of mine suitability. |
An exclusion layer was used to remove all land covers that were not desirable. After the model was run, the index was created into a map below (Figure 3).
 |
| Figure 3: Suitability model results. |
Community Risk Model
This model used five variables to determine the community risk of a frac sand mine in Trempealeau County.The five are:
- Prime Farmland
- Wetlands
- Residential Areas
- Schools
- Streams
Each of the variables were converted to a raster if they were not already, and then a suitability ranking was developed to determine how each variable would function as a frac sand mine (Table 2). These rankings were determined off of a variety of factors. The prime farmland layer rankings were determined off of ease of access to the prime farmland. If there is a higher chance of accessing the farmland, it is given a higher ranking. The wetlands layer was determined to offer a significant role in frac sand mine development. The reasoning behind this is based in a wetland's role in water access. They function as a filter to the water we drink, so removing wetlands increases the possibility of poor water access for the community. The ranking is based on how far frac sand mines are to wetlands. The high and medium development locations were extracted from the NLCD data base within this model. The legal limit a mine must be from a residential area is 640 meters. The rankings are based on this, and them multiplying 640 by 2 for each successive rank.
The rankings are as follows:
1= Low Community Impact Risk
2 = Medium Community Impact Risk
3 = High Community Impact Risk
 |
| Table 2: Community risk layer rankings and their justifications. |
Before reclassifying all of the layers to their rank orders, a few additional processes had to occur. The streams needed to have only perennial streams queried out so that only the largest risks were presented. A euclidean distance was then ran to determine the distance form these. The other 4 variables were all polygon layers and had to be converted to raster before continuing. Next, the schools had to be queried out from a parcel ownership database. After this, all four of the variables had euclidean distances performed, and then the results were reclassified based on the system above (Table 2). After this a model was built to combine all of the rasters into in index layer that displays community risk indexes (Figure 4).
 |
| Figure 4: Model used to determine community risk index. |
After the model was run, the index layer was used to create a map (Figure 5).
 |
| Figure 5: Community risk model results. |
Suitability and Community Risk Index
 |
| Figure 7: Results of both models completed, displayed side by side. |
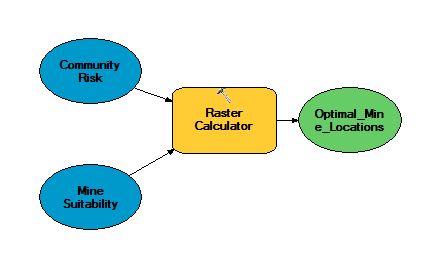 |
| Figure 8: Model built to combine both indexes to create a final result of potential mine locations. |
Results and Discussion
 |
| Figure 8: Results of combining both indexes together to discover potential mine locations. |
The map above displays the results of the methods. There are ten 30 m x 30 m (cell size) locations within the study area which indicate a high potential mine location. There are also forty-one cells which indicate an index of 9, which would also be a very high potential location. The areas that are the darkest orange display locations that have no potential for mines, and the closer the color gets to dark blue, the more optimal the location is for placing a frac sand mine.


Comments
Post a Comment